Your whole workspace
Heatmap, footprint, volume profile and DOM side by side, NQ and ES at the same time. Every window keeps up with the market.
Heatmap, footprint, Level 2 and order entry in one platform – on Windows, macOS and your phone, with exchange data from Rithmic or dxFeed.
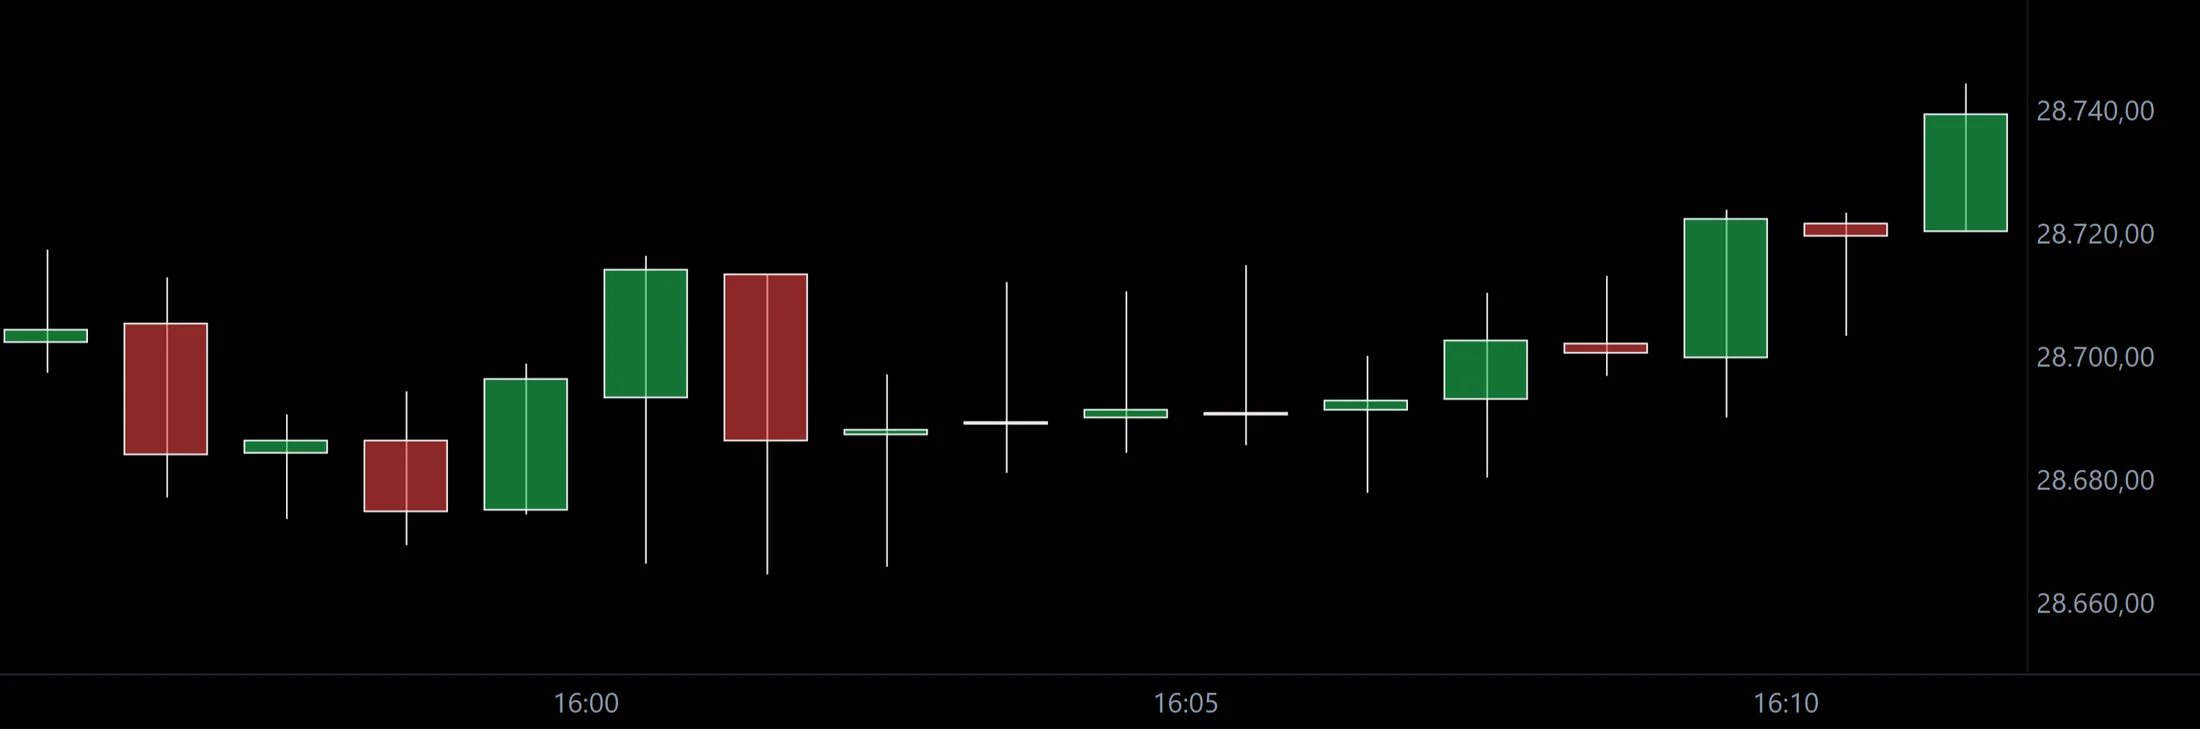
 Candles EdgeCharts heatmap
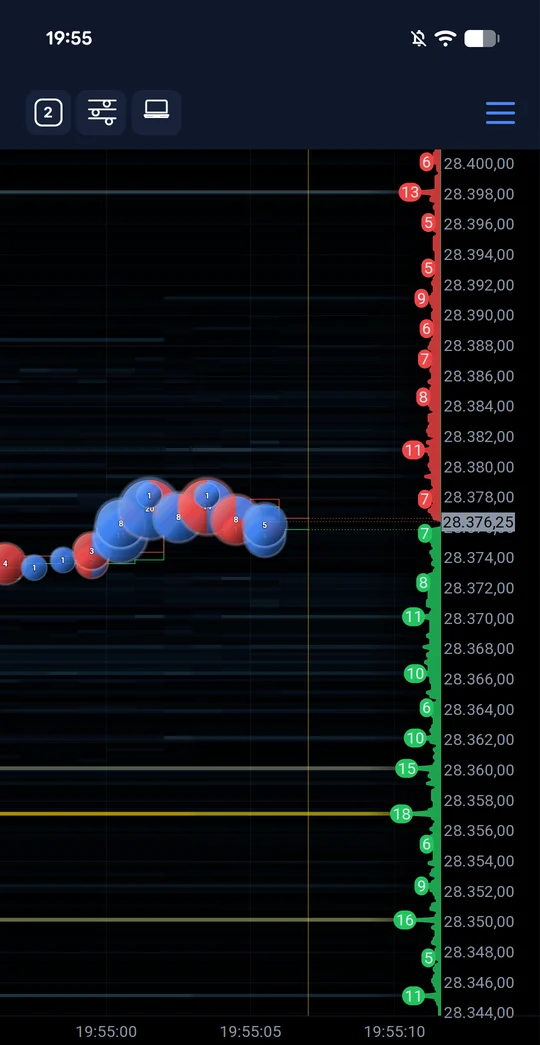
Follow where size is resting, where it trades and where it gets pulled – the information a candle never shows you.
Real recordings from the EdgeCharts app: tick replay and recorded order book of NQ and ES. Positions, accounts and the book sizes in the DOM are demo data.
No more switching between five tools. Orderflow, AI, execution and the trade copier live in the same workspace.
Heatmap, footprint, volume profile and DOM side by side, NQ and ES at the same time. Every window keeps up with the market.
Connect EdgeCharts to your own Claude Desktop. Claude reads the chart, draws zones, sets alerts and builds your own indicators.
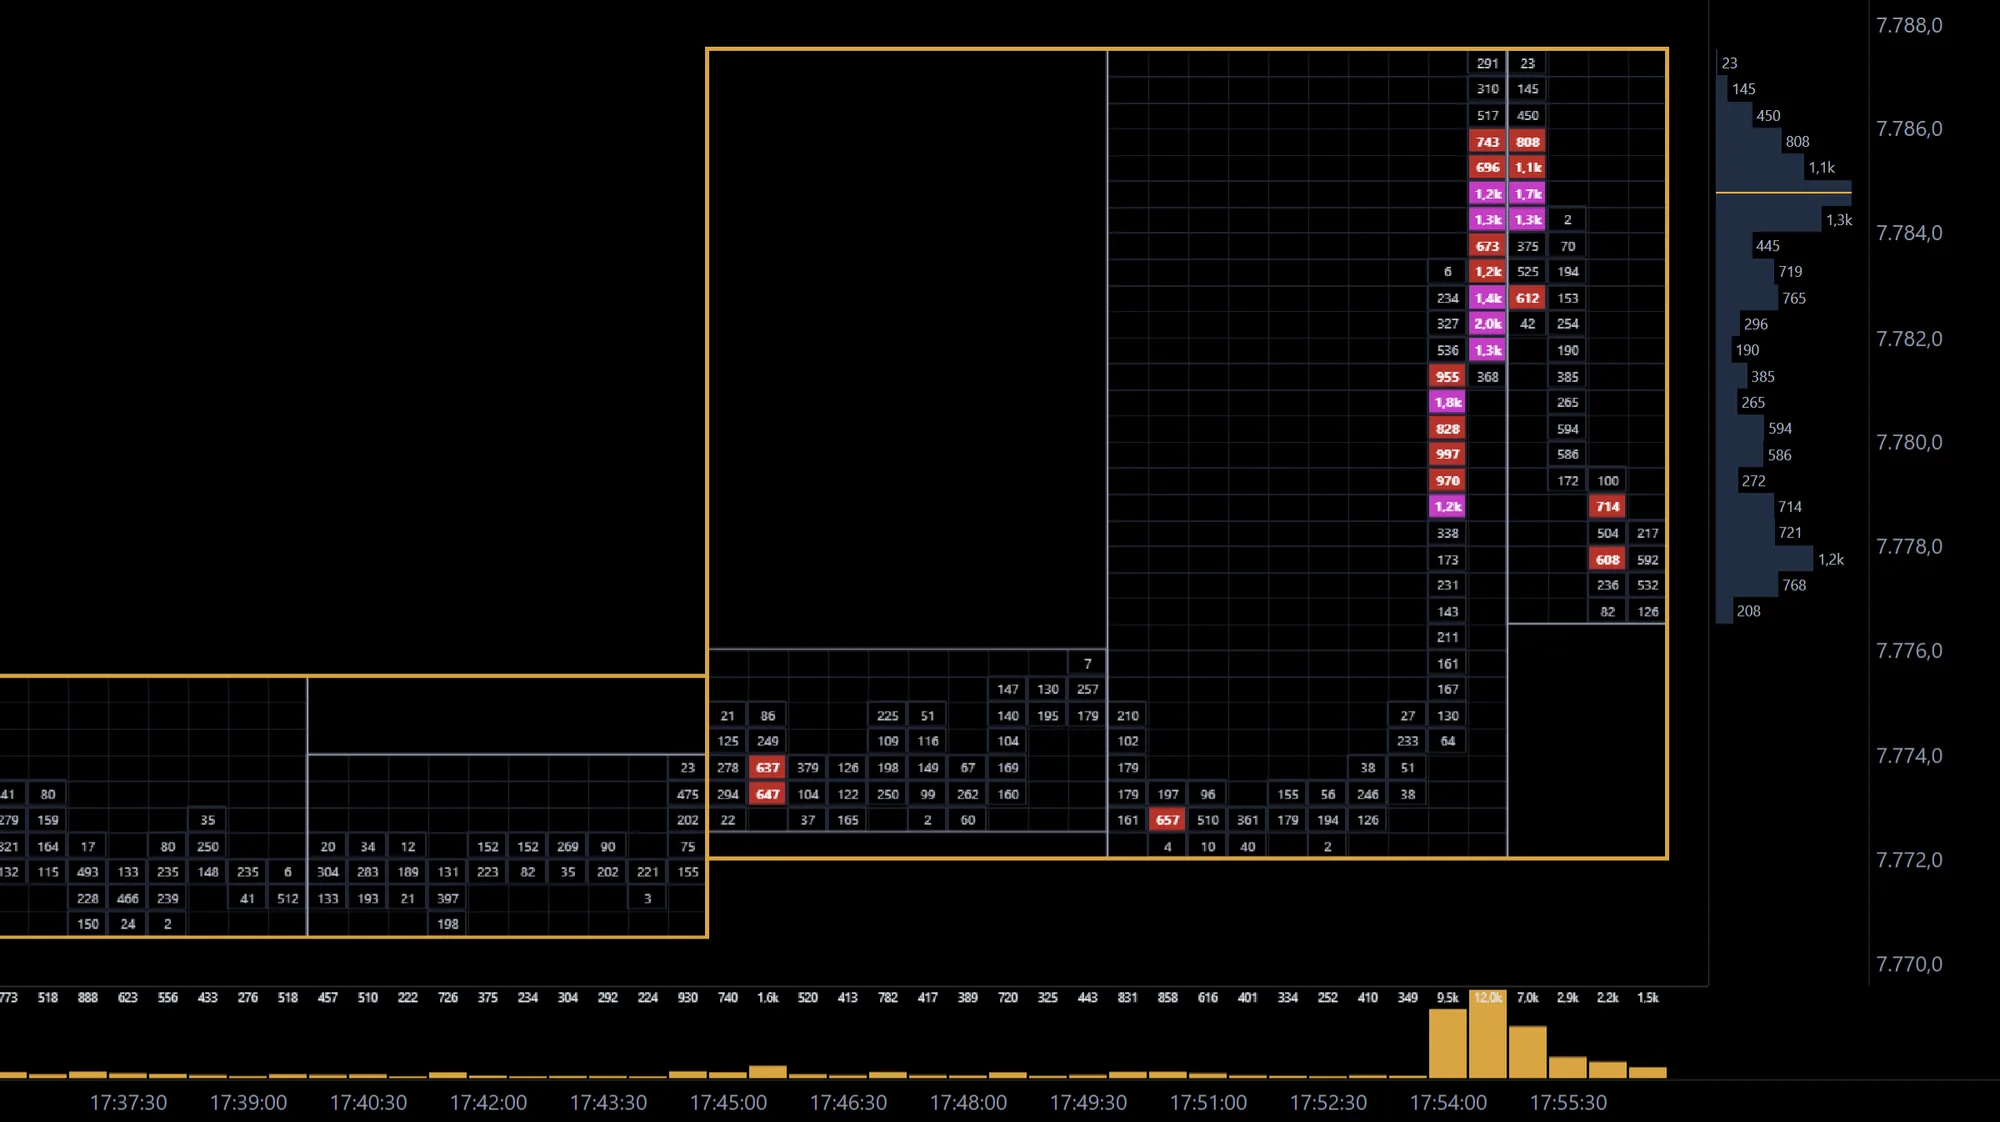
Short bars in clear frames with coloured thresholds. See where the market really traded and when it changed its mind.
Gamma exposure per strike from the live CME option chain, right on your futures chart. See where options dealers have to hedge.
Mirror one order across all connected accounts in real time – ideal for multiple prop accounts.
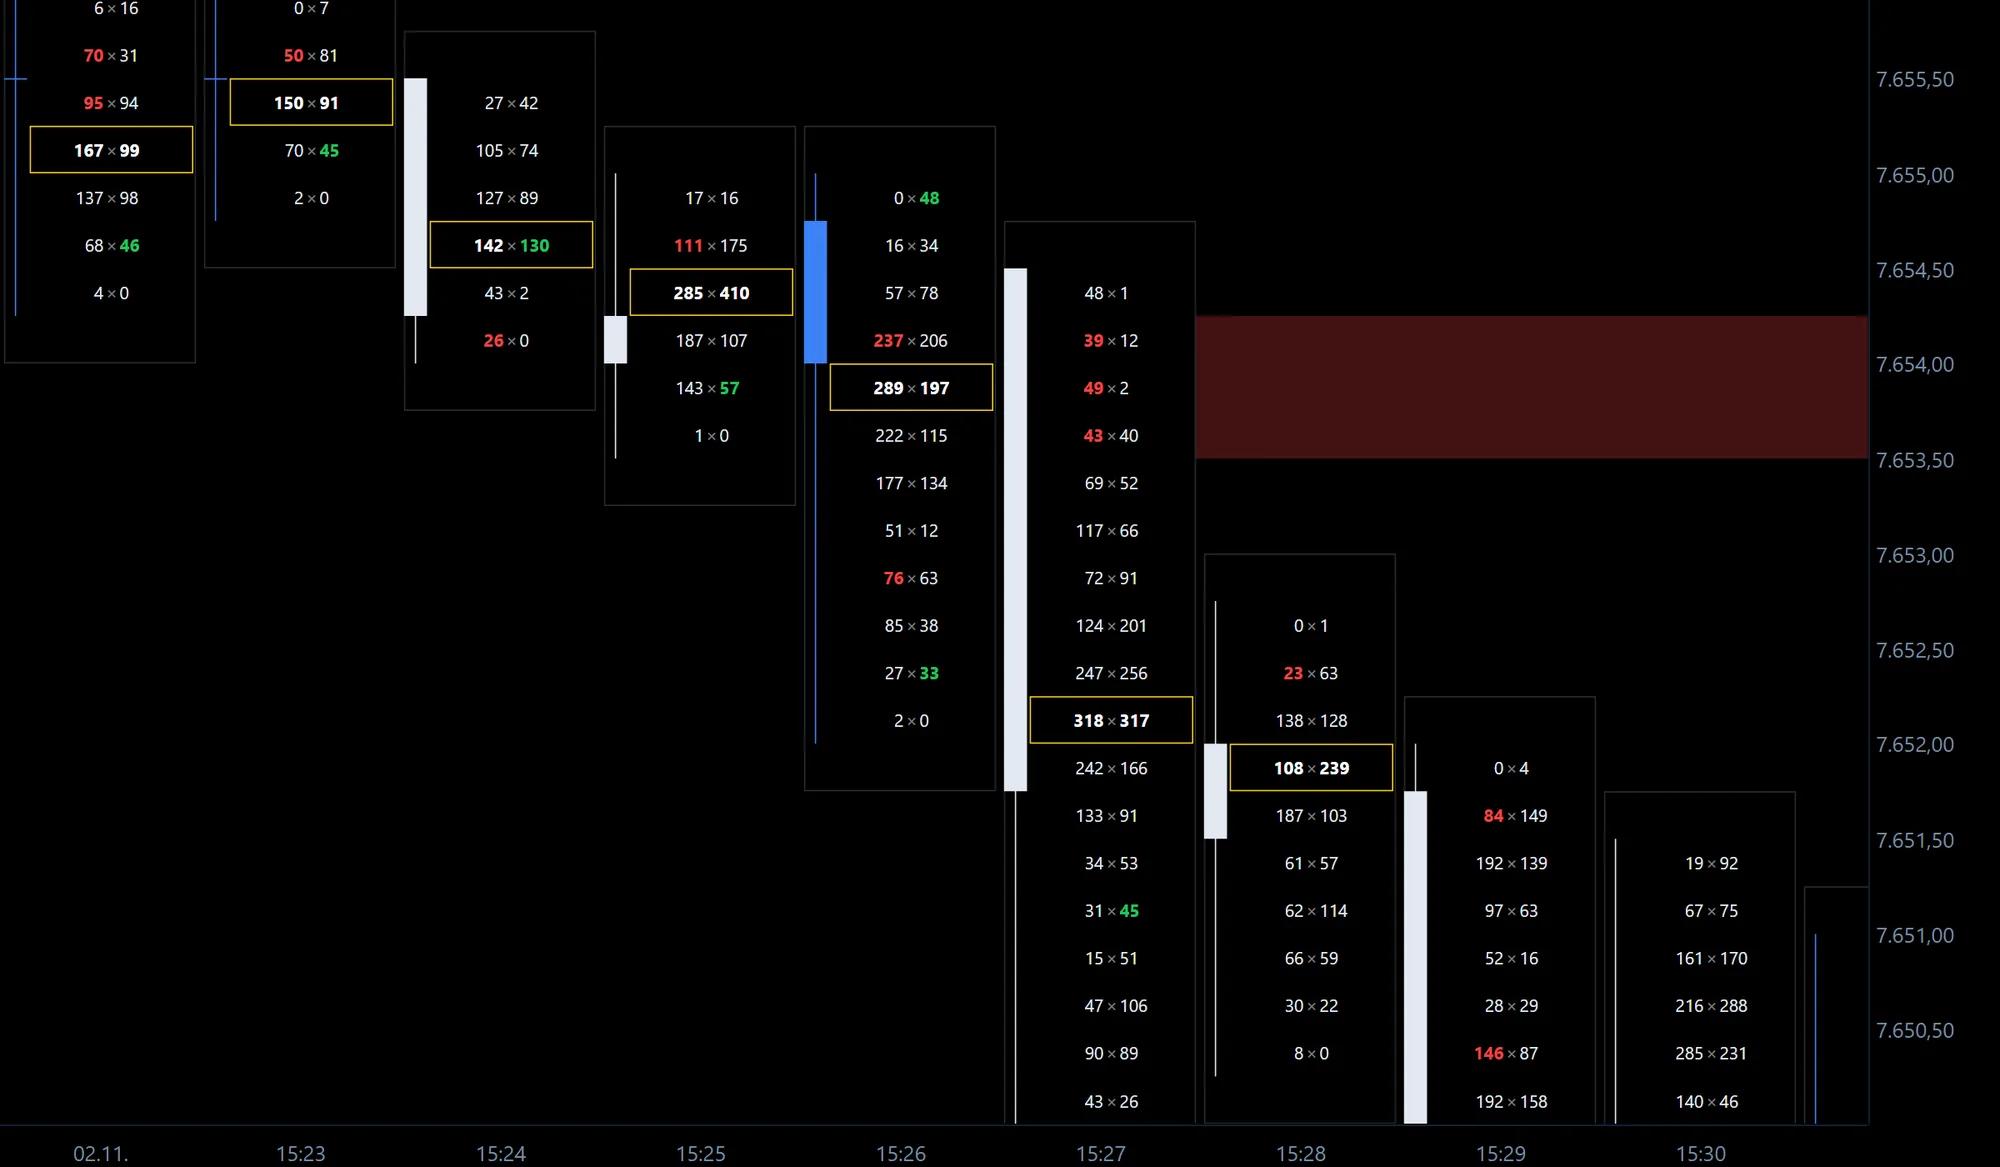
See inside every candle where buyers and sellers were aggressive. EdgeCharts highlights imbalances and stacked zones for you.
A bright line is a large resting limit order. If it ends right before price arrives, the order was pulled.
Heatmap, DOM, chart trading and the trade copier on your phone. Keep trading when you are away from the desk.
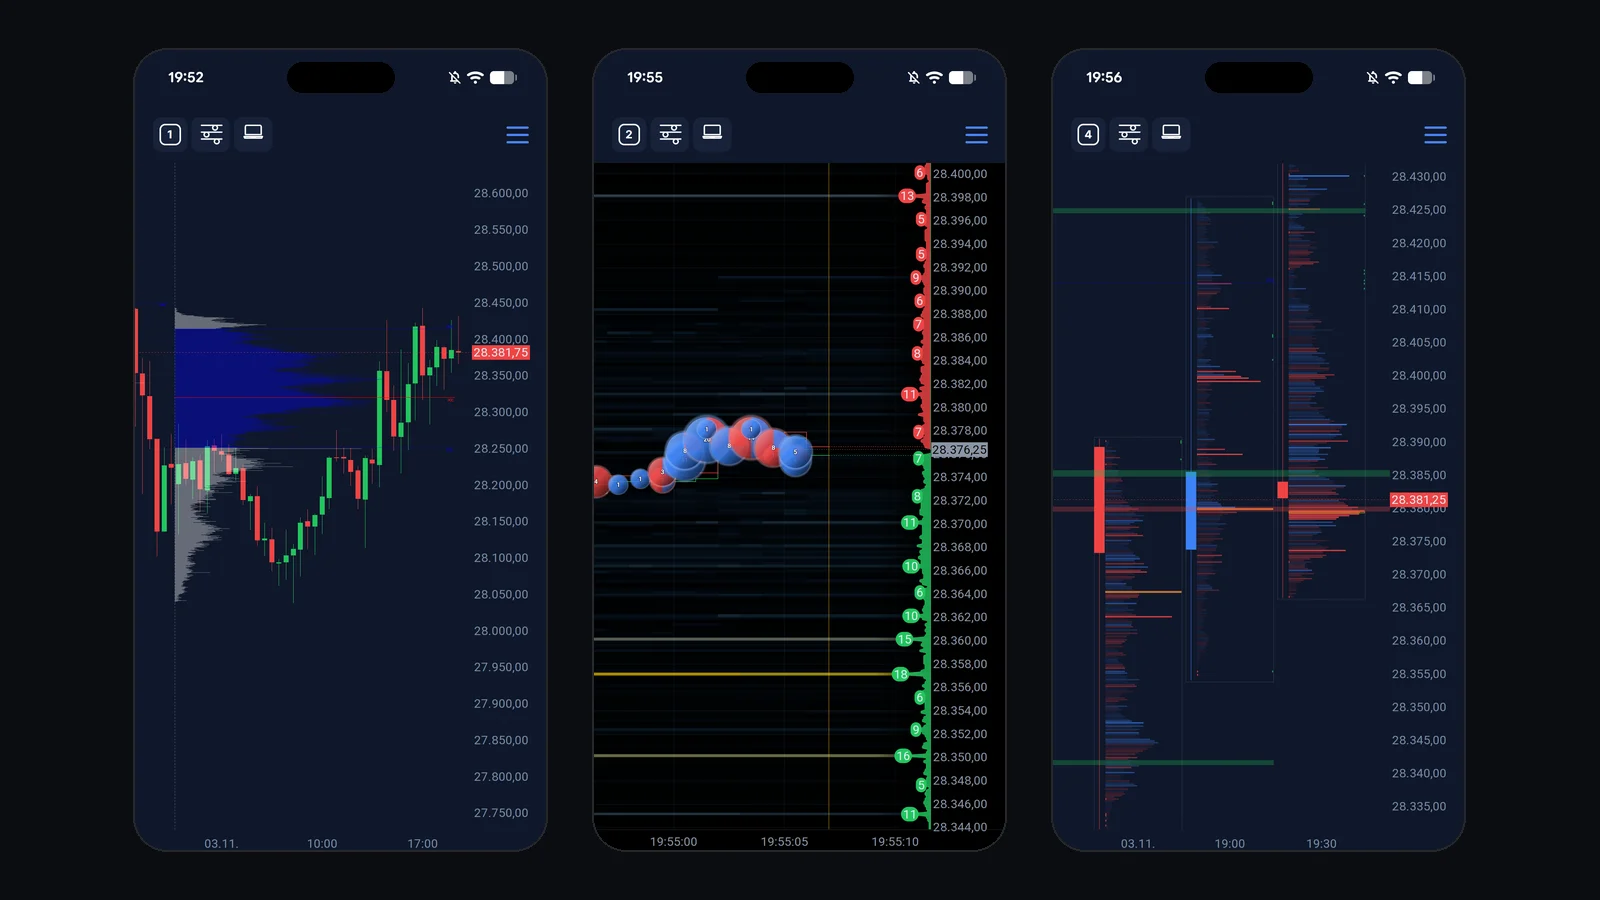
All images and videos are real recordings from the EdgeCharts app – accounts, trades and the order book sizes in the DOM are demo data. The options heatmap and the trade copier are illustrations.
EdgeCharts has no frame-rate cap. Charts, heatmap and footprint are rendered on the GPU and refresh with every frame of your monitor, at 60, 144 or 240 Hz. Your computer sets the limit, not the software.
The same chart engine on Windows, macOS, iPhone and Android. Analyse at your desk, keep trading on your phone with heatmap, DOM and trade copier.

Billed monthly, every 6 months or yearly. Cancel any time to the end of the paid period.